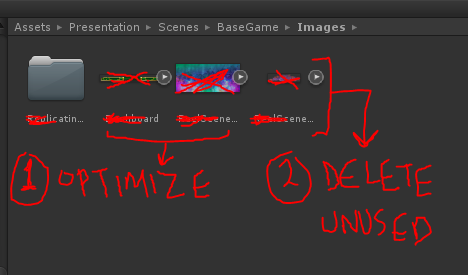
This article covers my self made methods to optimize something that was hard to access after known methods failed to help.
The game was now running a solid 60 FPS for the most part. But whenever we ran into multiple symbols on the screen, everything lagged down. We would touch close to 40 fps.Now, I know 40 fps doesn’t sound too bad for the player. But considering all the time we spent optimizing the game, it was running butter smooth.
So, a sudden, large change like that seemed a lot jarring. I’d even say if our game never ran around 50 fps and we went down to 40. Wouldn’t have felt so jarring. To fix this problem I had to take a some what unusual approach. I have a term for this, in the Hindi language.
It’s called “Jugaad”. (basically means: Jerry-Rigging / smokes & mirrors / hackery)
You’ll see me using this term often for a clever/unusual approach to solve a problem. In this case it was creating a fake scenario to force test the impact on performance.
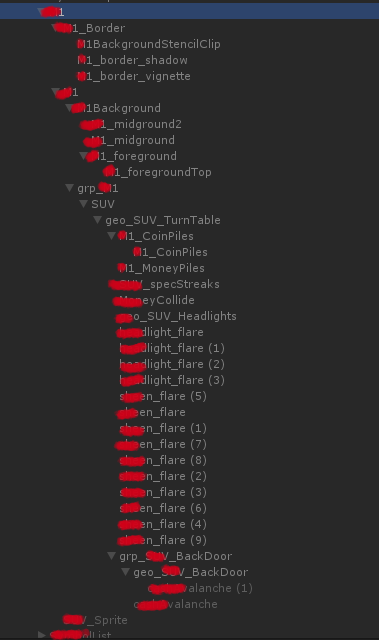
To start with, I identified which symbol reeked the greatest havoc. I did this by filling up the screen with all our symbols one by one. With this I found the culprit symbol, let’s call it “the symbol A“. The first thing that came into my mind was the fancy viewfinder effect I made for this symbol. All those stencil calls and Z-Depth tests would surely have knocked out a few frames.
Here’s a link to explain the effect. https://shahbazsekhon.com/art-viewfinder-symbol-effect/
But to my surprise, changing them had no impact on the average fps when the symbols would fill up the screen. So, feeling good that without knowing my Art in the game was quite optimized. I went on to try some other usual methods.
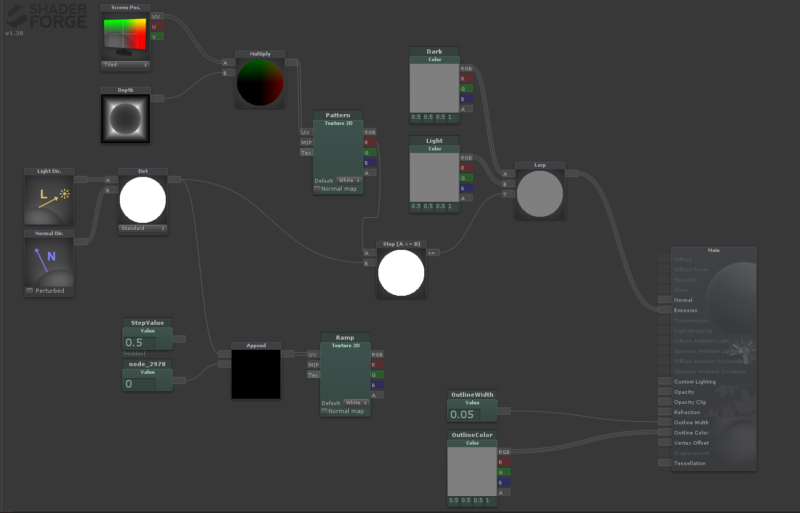
I reduced the texture sizes, optimized shaders by switching to mobile versions and added Stenciling support to them. I compressed the mesh from Unity’s mesh settings. But all my efforts seemed to be in vain!
Therefore, I got more inclined to get to the bottom of this! Turned on Unity’s Profiler for answers.
But for this problem, Unity’s Profiler sent me on a Goose Chase.
To see the impact each part of the symbol A had on the performance, I turned off each gameobject of the symbol, one by one. To my disbelief, Unity’s Profiler failed at giving me a standard scale of numbers. The numbers varied from average fps of 56 to 34, in the same feature without changing anything! Just because of different playthroughs.
After days of complaining and infinite search results, I gave up on Unity’s Profiler for testing this. I decided to make my own method of testing. I call it the “Saving Grace Method”.
A controlled environment with a test scene and just one symbol.
It’s essentially a mini Profiler of my own.
Here’s the quick script I made to do my bidding.
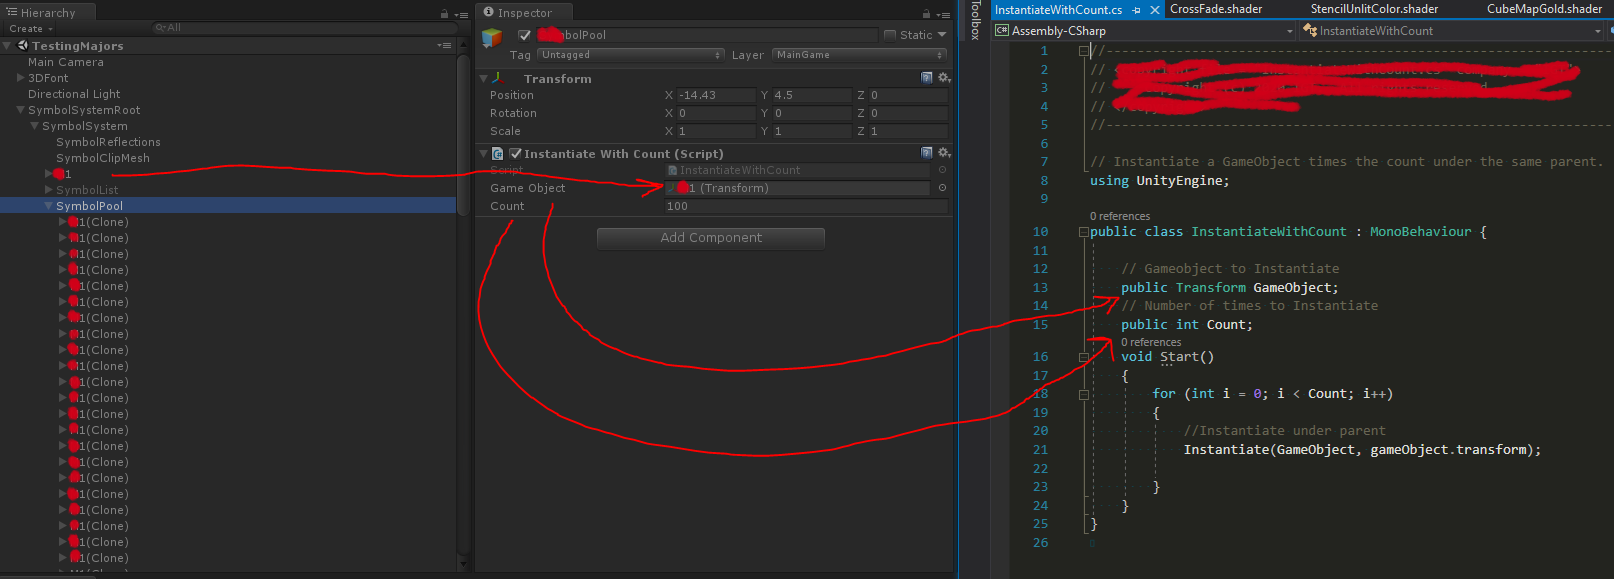
The Concept behind the “Saving Grace Method”…
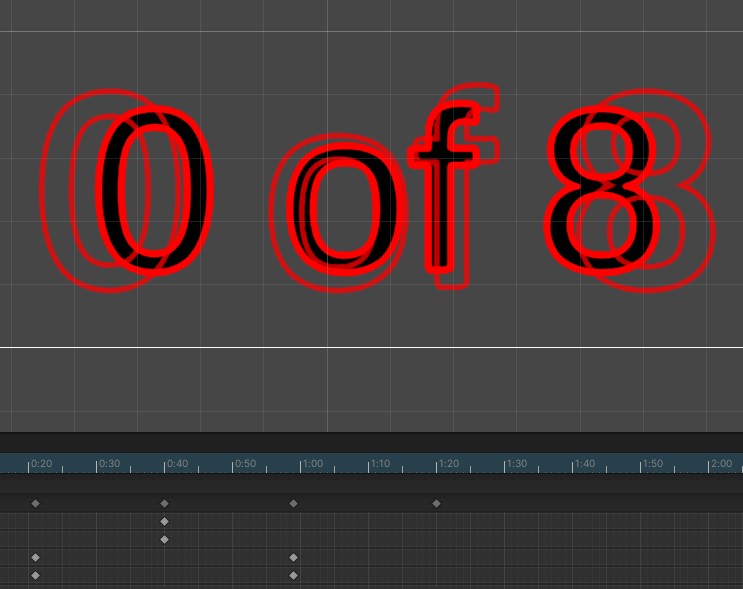
To use this method properly I had to have the symbol render enough times so that it would have a substantial impact on the GPU. On my Laptop that number was 300. On a co-worker’s PC it was 50. Essentially render so many of the same symbols on the screen that the GPU renders around 30 fps.
This allows you see how much impact turning off just one tiny part of the symbol can have overall.
So, basically earlier 100% of the GPU’s power was being used by different parts of the game. Some parts were UI, meter panels, reels, background, floor, sky and so on…This way of testing became hard if all I wanted to test was one symbol. Because under this scenario let’s say the symbol A could only take up to 10% of GPU’s power. Now when I was turning off parts of the symbol A, they could not have impacted the fps more than 10%.
I created a test scene in which the symbol A would take up 100% of the GPU’s power. Then the impact of each part of the symbol A would be easily visible.
On-wards to Testing…With the script and new test scene in play. I brought over my favorite symbol A into the test scene.
You can simply copy paste gameobjects between scenes in Unity.
Or another method for Unity 5 on-wards is to additively load another scene, copy paste gameobjects from that. Then Unload the scene. I turned off each part of the symbol A and finally started seeing its impact on the average fps!
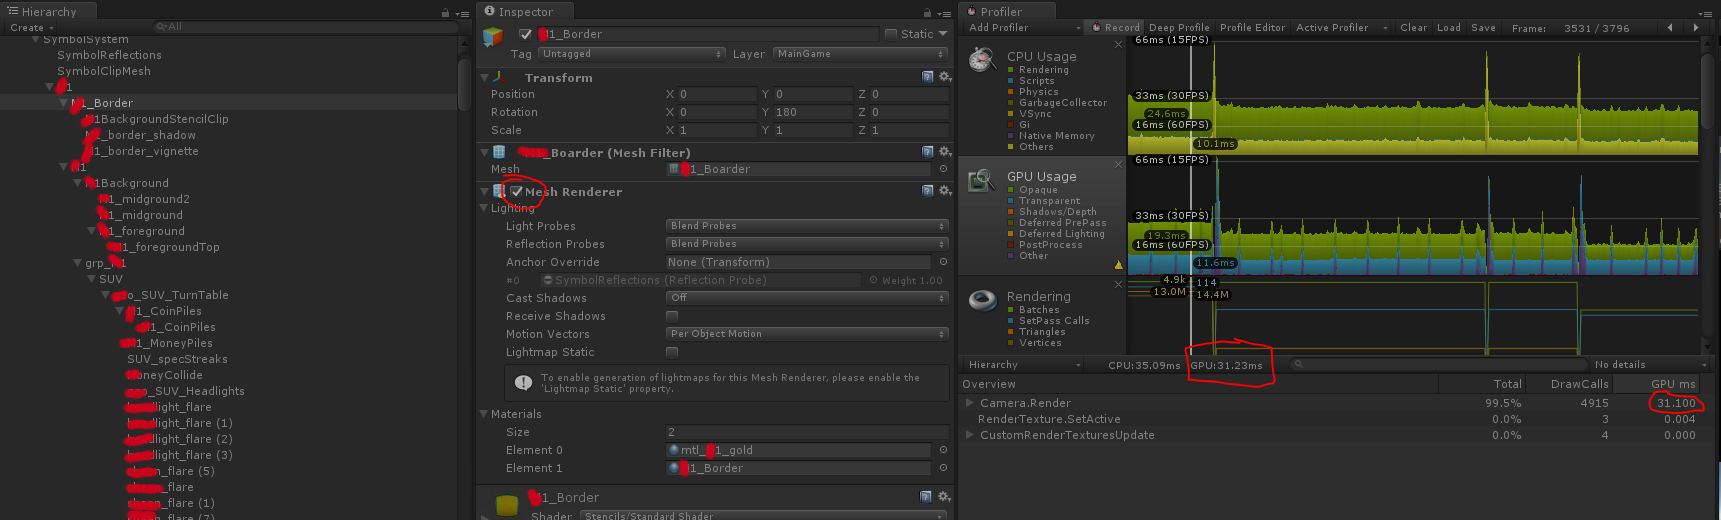
This method of testing finally gave me consistent fps numbers to test. I was finally heading in the direction to optimize this asset. So, one by one I would turn off a gameobject, then run the scene again. Tally the impact it made on the fps compared to the previous run. And repeat.
This way, I finally found my culprit!
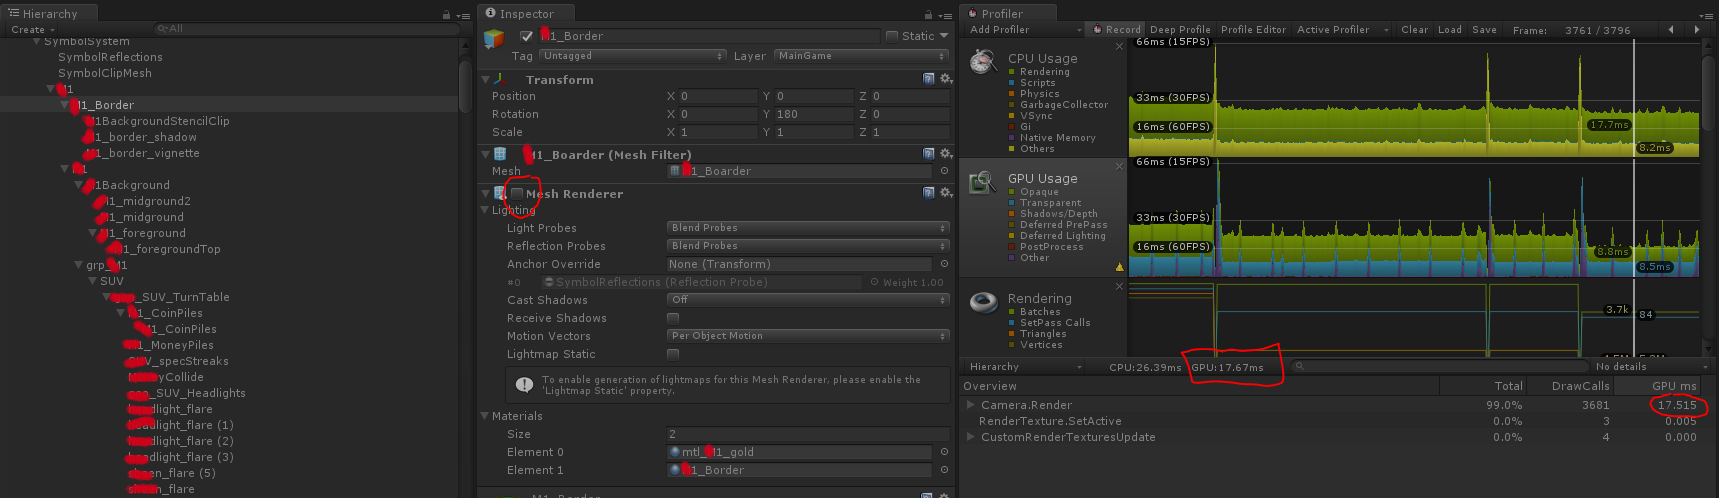
Not the stencils, texture density, fancy shaders or wasteful alphas were the clear winners for impacting performance here. It was simply the mesh, that impacted the GPU so much. Turning off the Mesh Renderers changed the average fps from 30 to 54!
Knowing the mesh is the biggest culprit, I started optimizing the mesh inside Maya. https://shahbazsekhon.com/optimization-meshes/