This article covers the setup for the amazing Unity Debugger in Visual Studio for runtime debugging.
This was probably the first thing I was told when I installed Unity. Don’t use Monodev and get Visual Studio…I still got Monodev because it was free…and Visual Studio Community wasn’t a thing back then. Though I somewhat remember some form of a Free Licence IDE from Microsoft before Visual Studio Community. Anyway, I had dabbled in Visual Studio, a long time back but never really used it as my preferred IDE for any type of programming. I had a Macbook during my Undergrad so I just used XCode. Only during my Masters did I get a licence for Visual Studio.
With that covered, let’s get back to this awesome tool.
Visual Studio’s debugging environment provides a tool to test code during game’s runtime.
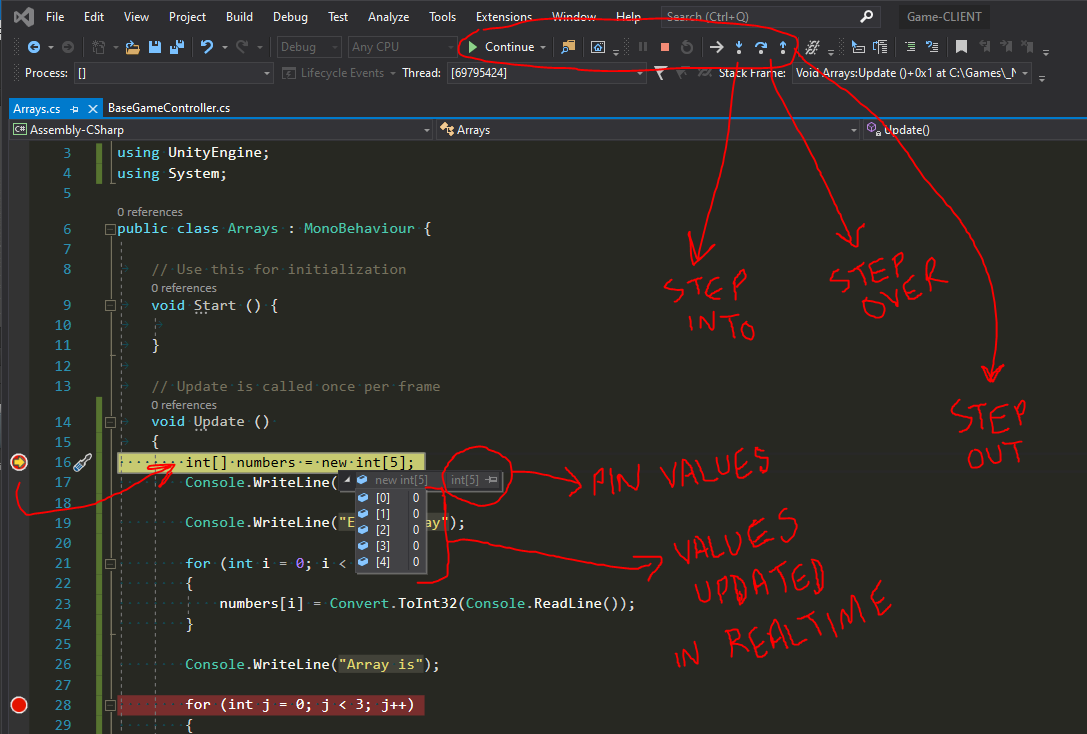
As an overview, you do this by setting a up a break-point. Attaching the Unity Debugger to the Unity Game-Client. Then press play in the Unity editor. When you hit the break-point the Game will pause and reopen your minimized Visual Studio awaiting instructions. From here you can go into methods, see the game’s logic, test out variable values and see those values update as you step through getters or setters or method arguments. Pretty awesome tool compared to the infinite Log writing to console, I used to perform when I started programming.
I ll now go over the steps to install and use this amazing tool.
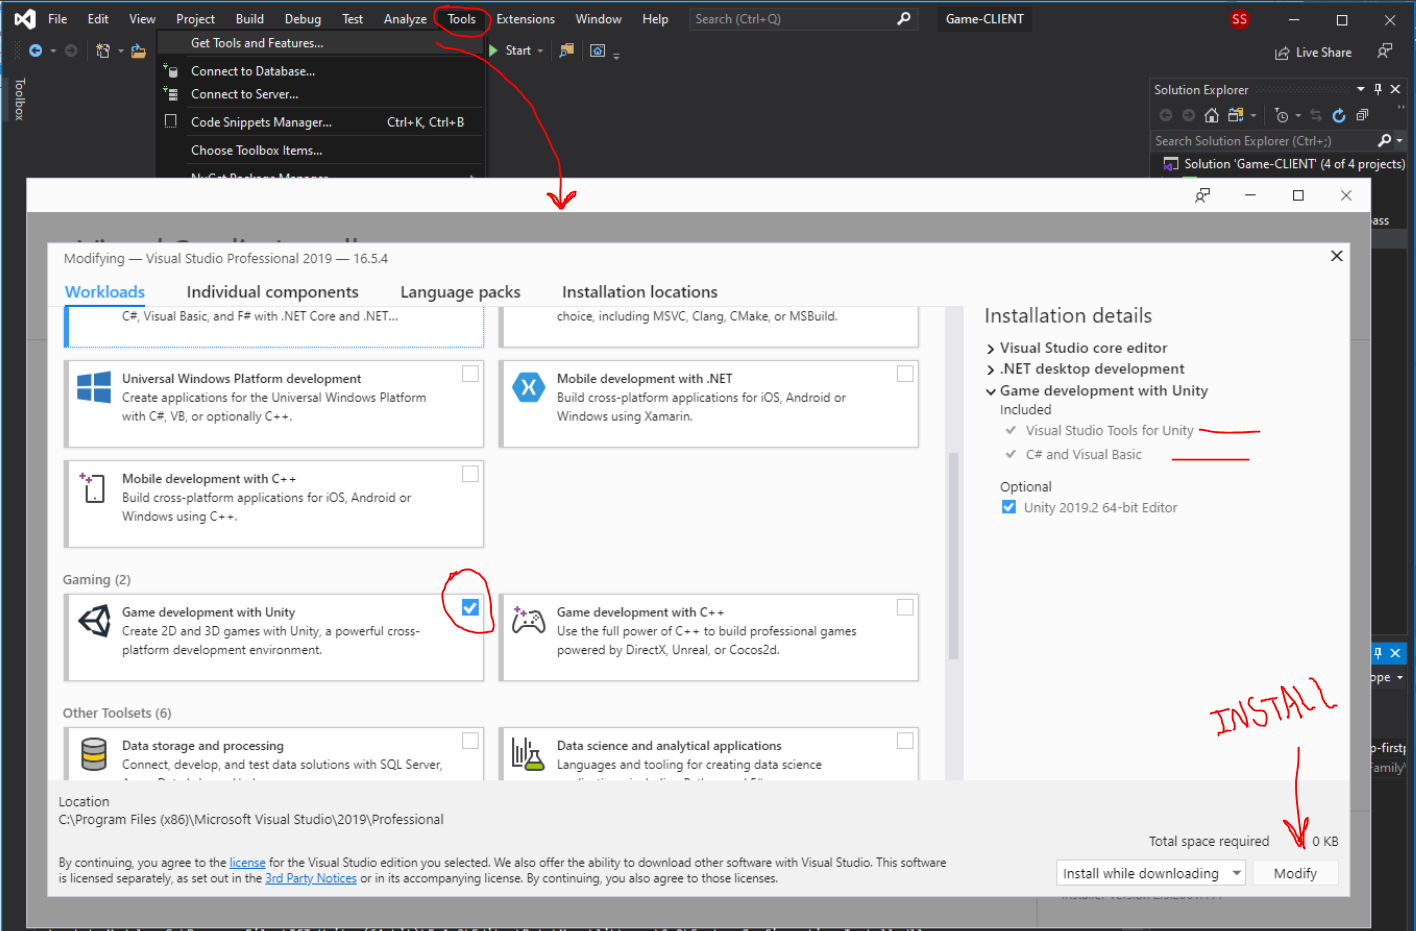
1. Install Game Development for Unity in Visual Studio. To do this, go to the Tools Menu. Then go to Get Tools and Features. In the new opened Window, under Workloads go down to Gaming. In Gaming select Game Development for Unity and install it. This will install Visual Studio Tools for Unity and libraries for C# and Visual Basic if you need those too. Restart Visual Studio.
2. That should complete the requirements for the tool. Now, set a break-point in a script that will hit when you run the game. After you set the break-point, go to Debug Menu and select Attach Unity Debugger. In here you should be able to see your Unity Game’s Client if the Unity Editor is running in the background. Select your Game’s Client and press OK.

3. Now Visual Studio should be Debugging mode. Go back to your Unity Editor and press Play. Once the break-point is hit, the game will pause and your Visual Studio Window will maximize. The Game is now awaiting instructions and will stay paused till you go out of scope on your break-point in Visual Studio. You can hover your mouse over variables to see their values updated real-time. You can pin variables to keep a check on their values. To move about the code you can, use Step Into the code block, Step Over the code block or Step Out of the code block.